
Remember the adage that goes “A picture is worth a thousand words”? This is especially true for C-suite employees, and for that matter, anyone in an enterprise when making impactful business decisions using data. The decisions business leaders make can have far-reaching effects on the business-whether it is about changing the existing processes or implementing new protocols, or even turning down certain opportunities otherwise considered beneficial by peers across the organization. The volumes of data business leaders sift through are massive and complex enough to derive actionable insights and make high-impact business decisions. And that’s where things are about to change for good with business intelligence using AI.
It’s time to move beyond static charts and spreadsheets. With the rise of Generative AI data visualization, we’re entering a new era of data reporting and data storytelling. This blog gives business leaders and entrepreneurs a new perspective on AI-powered data visualization and how it is a new paradigm for corporate decision-making.
So, what’s new with AI visualization for enterprises and business leaders?
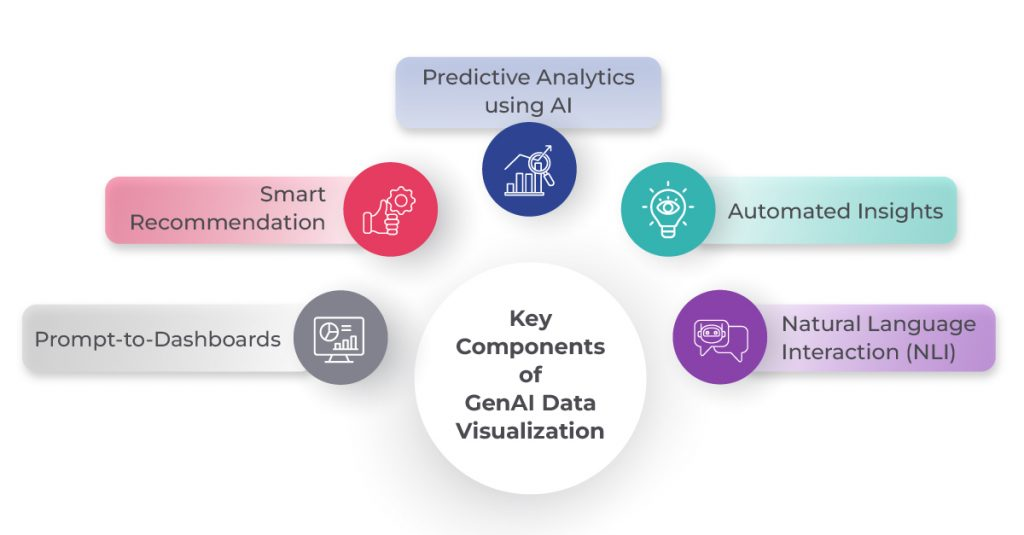
For C-level executives and business leaders, the ability to quickly grasp the story their data is telling is paramount. Intelligent data visualization tools act as a translator, turning rows and columns of numbers into a compelling narrative that changes the way leaders deal with data reporting and data exploration. This is crucial for delivering powerful, data-driven presentations and reports across the organization. Here are the key components of data visualization powered with AI:
> Natural Language Interaction
One of the most powerful features of AI in data visualization is its ability to let users query their data simply by asking questions in natural, everyday language. Instead of relying on data experts to write complex queries, a C-level executive who wants to present an idea or report a business activity to their team can simply type, “What’s our most time-consumed IT ticket in 2025?” The AI uses Natural Language Processing (NLP) to understand the request and automatically generates the relevant answer in a jiffy.
> Automated Insights & Anomaly Detection
AI algorithms continuously scan datasets to proactively identify and surface significant information that a human might miss. This includes automatically detecting correlations, segmenting data, and flagging anomalies or outliers. This way business leaders get immediately alerted to the most critical insights, for example, a sudden drop in customer engagement or a spike in supply chain costs, saving them the effort of manual data exploration.
> Predictive Analytics and Forecasting
Modern AI visualization tools go beyond showing historical data. They use machine learning models to analyze past trends and predict future outcomes. This allows leaders to run what-if scenarios and forecast key business metrics like sales revenue, customer churn, or inventory needs. It transforms data visualization from a reactive reporting tool into a proactive strategic planning asset.
> Smart Recommendations & Prescriptive Analytics
This is the most advanced component. AI-powered visualization doesn’t just show you the descriptive analytics or predictive analytics, but it also recommends specific actions to take – prescriptive analytics. For example, if the AI data visualization tool predicts a sales dip, it might suggest a targeted marketing campaign for a specific customer segment or recommend a pricing adjustment to optimize revenue.
> Prompt-to-Dashboards
You can automatically generate entire dashboards and reports tailored to a specific user’s role and context using natural language prompts. With automated dashboards in place, business users can identify what metrics are most important to a marketing executive versus a COO and customize the view accordingly. These dashboards are dynamic, updating in real-time and allowing leaders to drill down into the data with a single click, ensuring they always have the most relevant and up-to-date information at their fingertips.
Key Components of GenAI Data Visualization
How Intelligent Data Visualization Empowers C-Suite Leaders?
For C-level employees, time is the most valuable commodity. They need to make powerful decisions quickly and communicate them effectively across the organization. AI-powered data visualization provides the clarity and speed required to do this.
Faster, More Accurate Decision-Making: AI-powered data visualization dashboards can instantly visualize sales performance against market benchmarks, identify underperforming regions, and adjust strategy on the fly.
Powerful, Story-Driven Presentations: Instead of a dense report, a CMO can show an animated chart that illustrates how a specific ad campaign directly influenced customer engagement, making the impact tangible and easy to grasp for stakeholders.
Enhanced Communication & Alignment: Shared dashboards powered by AI create a single source of truth so that your users across the organization can see the direct financial consequences of their actions.
AI Data Visualization Tools – Your Powerful Co-Pilots for Enterprise-Grade Data Exploration and Reporting
Traditional business intelligence tools can be slow and require specialized skills. This is where AI data visualization acts as a powerful co-pilot, a trusted partner that automates and accelerates your journey from data to decision. By democratizing access to complex analytics, AI visualization helps C-level executives make smarter, data-backed decisions without being data experts.
The Strategic Advantage for Executives
For C-level leaders, the benefit is not just about efficiency; it’s about strategic advantage. AI data visualization elevates your decision-making by improving speed and agility. AI-generated visuals and automated report generation make it easier to present complex information to stakeholders. The days of relying on a data analyst to create custom reports are over. With AI-powered visualization, enterprises can transform complex information into clear, executive-ready insights with the power of AI.
 Write to Us