Decode Complicated Data to Compelling Stories with Our Gen-AI Powered Data Visualization Services
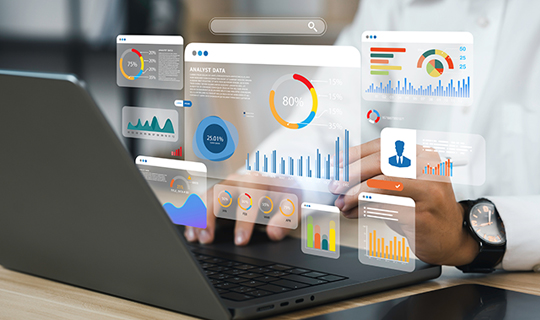
Revolutionize your data storytelling with our GenAI-powered Data Visualization Solutions. We transcend traditional charts, crafting dynamic, interactive experiences that unveil profound insights. Harnessing the power of generative AI, we transform complex datasets into compelling visual narratives, enabling rapid comprehension and informed decision-making
Our services extend beyond standard visualizations. From intricate network graphs to intuitive geospatial maps, we create visuals that resonate with your audience. Experience the efficiency of AI-driven design, where natural language prompts instantly translate into insightful visual representations. Elevate your strategic oversight with our interactive data visualization dashboard. Our dashboards are not mere static displays; they are interactive tools that allow deep-dive exploration, enabling you to extract actionable insights.
Success Stories
Generative Visualization Platform
Our Generative Visualization Consulting Services guide you to leverage AI for dynamic insights. Experience real-time data dashboards, capturing live feeds for immediate action. We employ advanced analytic techniques to unravel hidden patterns, transforming complex data into clear visuals. Our interactive data visualization dashboard provides a comprehensive, customizable overview, empowering informed decisions. AI-driven visualizations streamline analysis, making complex information digestible and actionable, driving strategic growth and operational efficiency.

Data Visualization Services & Solutions

Custom Visualization Design
A customized visualization design provides a tailored and unique view of a specific topic. This includes selecting the most appropriate design to effectively communicate key insights across the organization.

Interactive Dashboards
With interactive dashboards, users can have access to dynamic views of their data to explore data, drill down details, and filter information to enhance user engagement and decision-making.

Data Integration Solutions
Integrate data from multiple sources to consolidate data on a single platform. This way organizations can create unified visualizations that offer comprehensive insights into their operations across multiple teams.

Real-Time Visualization
Real-time visualization capabilities enable organizations to monitor key metrics and KPIs as they change in real-time. This allows organizations to make proactive decisions and create immediate responses to relevant trends.

Advanced Data Analytics
Incorporate advanced analytics techniques, such as predictive modeling, clustering, and trend analysis, to uncover hidden patterns and relationships within the data to identify insights and opportunities.

Mobile-Friendly Visualization
With the increasing use of mobile devices, companies should ensure that visualizations are responsive and optimized for viewing on smartphones and tablets enabling users to access insights on the go.
Why Choose Aspire as Your Data Visualization Consulting Partner?

Reduced Dependency on Data Team

Reduced Time-to-Insight

Handle Dynamic Data Needs

Enhanced Decision-Making Speed

Reduced Development Costs

Improved Accessibility & Usability

Ensure Scalability & Adaptability

Business Intelligence Consulting
Our comprehensive Business Intelligence solutions can help your enterprise transform raw data into actionable intelligence. Our expert team specializes in enterprise data modelling, creating robust frameworks that align with your business objectives. Experience streamlined reporting, interactive dashboards, and predictive analytics, all tailored to drive informed decisions. Leverage our BI solutions to optimize operations, enhance customer understanding, and gain a competitive edge with insightful visualizations to ensure your organization maximizes the value of its data assets.
Business Intelligence Services & Solutions

Data Modelling & Analysis
Enabling organizations to structure and analyze their data effectively by creating data models, defining key metrics, and performing exploratory data analysis with cutting-edge tools and techniques for data modeling.

Reporting & Dashboards
Visualize data and communicate insights effectively and customize dashboards, interactive charts, and scheduled reports for stakeholders at all levels using our business intelligence strategies.

Ad Hoc Querying
Perform ad hoc queries and exploratory analysis on your critical business data. This facilitates quick and flexible access to information, empowering users to answer specific questions and uncover insights on the fly.

Mobile Business Intelligence
With the increasing need for data accessibility on-the-go, we offer mobile BI capabilities that allow users to access reports, dashboards, and insights from their mobile devices, anytime and anywhere.

Advanced Analytics
Our solutions incorporate advanced analytics techniques, such as predictive modeling, ML, and AI, to uncover hidden patterns within the data, enabling organizations to make data-driven predictions and optimize future outcomes.

Data Integration
Integrate data from various sources, such as databases, spreadsheets, and cloud applications into an intuitive, highly scalable data repository. This enables access to a unified view of important data required for continuous analysis and reporting.
Create impactful data experience where it matters across the organization


